
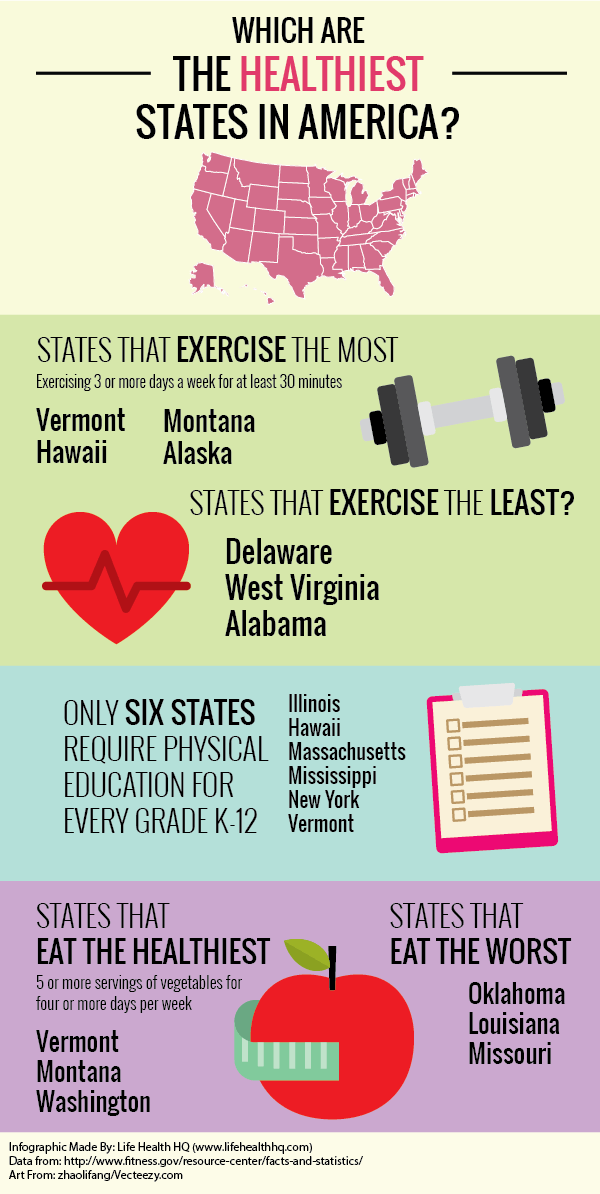
Which US states eat healthy and exercise regularly? We’re about to find out in this infographic detailing the healthiest and least healthy states based on data provided by the President’s Council on Fitness, Sports, and Nutrition. How healthy is your state? It’s time to find out!
This Healthiest States in the USA Infographic was created by Life Health HQ, with data from the President’s Council on Fitness, Sports & Nutrition.
The infographic examines two major factors to determine state health – exercise and healthy eating.
Which States Exercised The Most?
In a 2013 study by the President’s Council on Fitness, Sports & Nutrition, researchers surveyed adults to see how many individuals reported regular exercise. For this study, regular exercise was defined as exercising 3 or more days each week for at least 30 minutes.
The states reporting the most exercise were:
- Vermont (65.3%)
- Hawaii (62.2%)
- Montana (60.1%)
- Alaska (60.1%)
The states that reported the most levels of exercise were also states known for their selection of outdoor activities and outdoor lifestyle, which may have helped contribute to the higher levels of physical activity.
US states reporting the lowest levels of exercise (exercising less than 3 or more days per week for at least 30 minutes) were:
- Delaware (46.5%)
- West Virginia (47.1%)
- Alabama (47.5%)
The national average for regular exercise was found to be 51.6%
Healthy Eating Data: Which States Eat the Healthiest?
In the same study, state residents were asked to report on their healthy eating habits. In this study, healthy eating habits were defined as eating 5 or more servings of vegetables on 4 or more days each week.
The US states that reported the healthiest eating habits were:
- Vermont (68.7%)
- Montana (63.0%)
- Washington (61.8%)
The states reporting the lowest amount of healthy eating were:
- Oklahoma (52.3%)
- Louisiana (53.3%)
- Missouri (53.8%).
The national average for healthy eating is 57.7%.
More Health and Fitness Data
Other interesting research discovered in this healthiest states in the USA study:
- Only 1 in 3 children are physically active each day.
- Only 1 in 3 adults receive the recommended amount of physical activity each week.
- Over 80% of adults do not meet the guidelines for aerobic and muscle-strengthening activities.
- More than 23 million Americans live in food deserts – areas that are over a mile away from a supermarket, leaving residents to shop at connivence stores with poorer food choices and few (if any) options for fruits and vegetables.
- Since the 1970s, the number of fast food restaurants has more than doubled.
- 40% of total daily calories for 2-18 year olds come from added sugars and solid fats.
- 50% of those empty calories come from six sources: soda drinks, fruit drinks, dairy desserts, grain desserts, pizza, and whole milk.
- About 90% of Americans eat more sodium than is recommended for a healthy diet.
- Reducing the sodium Americans eat by 1,200 mg per day could save up to $20 billion a year in medical costs.
- Projections suggest that by 2030, half of all adults (115 million adults) in the US will be obese.
- Food safety awareness goes hand-in-hand with nutrition education. In the United States, food-borne agents affect 1 out of 6 individuals and cause approximately 48 million illnesses, 128,000 hospitalizations, and 3,000 deaths each year.
- US per capita consumption of total fat increased from approximately 57 pounds in 1980 to 78 pounds in 2009 with the highest consumption being 85 pounds in 2005.
- The US percentage of food-insecure households, which are defined as household with limited or uncertain ability to acquire acceptable foods in socially acceptable ways, rose from 11% to 15% between 2005 and 2009.
Were you surprised to see which US states were the healthiest? Do you live in one of the healthiest states in the USA? What about the least healthy states – were your surprised to see which states have the worst eating habits and the lowest levels of exercise?
Tell us your thoughts in the comment section below!
Featured photo credit: Life Health HQ via lifehealthhq.com


