
Today’s the age where we are social, albeit in a digital way. With the advent of social networking sites, video sharing platforms, blogging services and micro-blogging networks, our social activities have taken digital form.
We Are Social is a global conservation agency having its offices in different locations of the world such as New York, Paris, Munich, Milan, Sydney, London and Sao Paulo. Their objective is to help companies with conversations on social media. You can learn more about them at their website.
We Are Social also provides guidance on use of social media to promote brands, guiding them on correct social media image sizes, promotion and social media posts. We Are Social published a report titled Digital, Social and Mobile in 2015, documenting interesting digital trends of the year 2014 and predicting those or this year. Covering 240 pages and compiled into 376 pages, it provides us with complete and up-to-date digital statistics.
These data are highly useful for business people to do their marketing. We have selected 30 most important slides from the report, which includes a slide per page. These are representative slides of the report and the ones containing the most valuable information.
1. Global Digital Snapshot
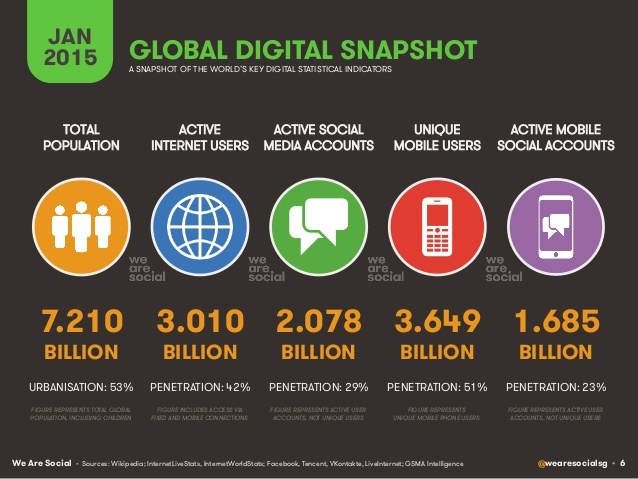
In approximately 7.2 billion population of the world, 3 billion are active internet users, which is 42% of the world population. There are little more than 3.6 billion unique mobile users and 2 billion people have active social media accounts.
2. Year-on-year Growth
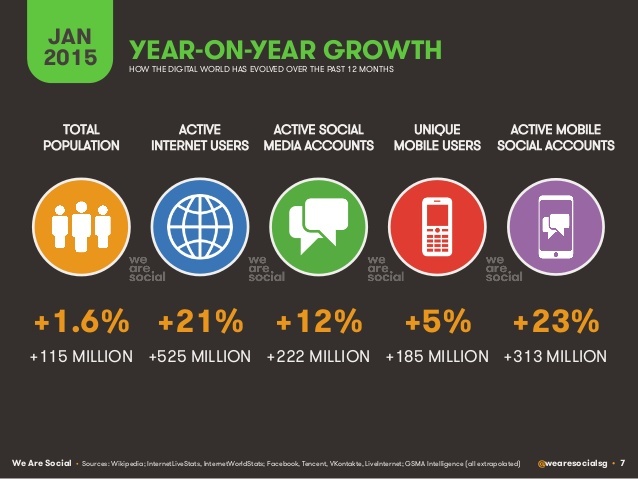
While the world population increased by 1.6% in 2014, active internet users increased by 21%. Mobile users increased by 5% while active social media accounts saw 12% increase.
3. Share of Global Users
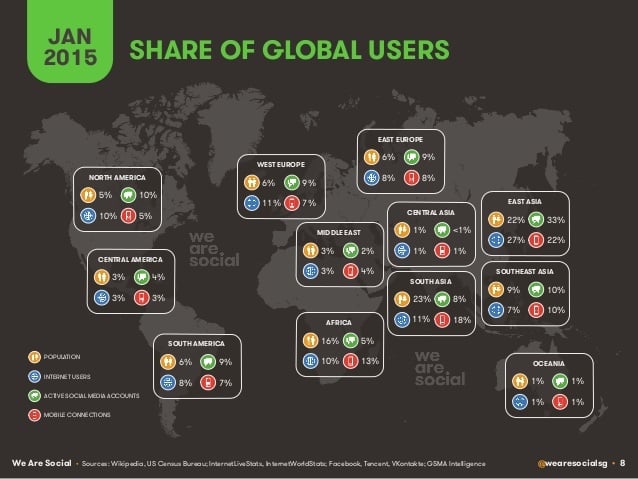
The above image shows the share of global users. Largest percentage world population leaves in East Asia and it also has the largest percentage of internet users, active social media accounts and mobile connections.
4. Internet Use
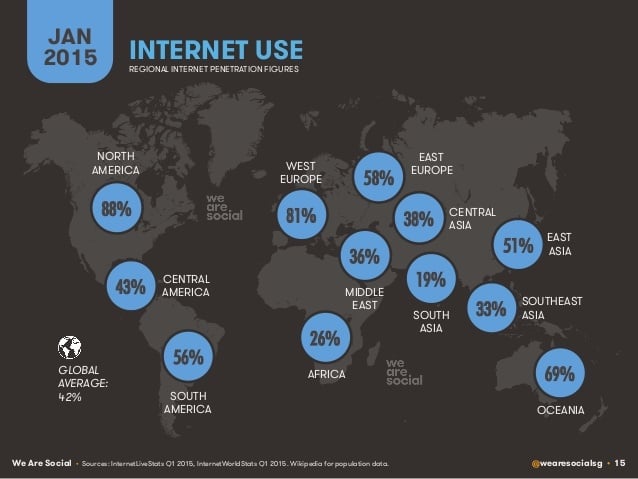
Although East Asia has largest population of internet users, percentage of highest internet penetration within a particular region happens to be in North America. 88% of the population is connected to internet there while South Asia ranks the lowest with only 19% internet penetration.
5. Internet Regional Overview
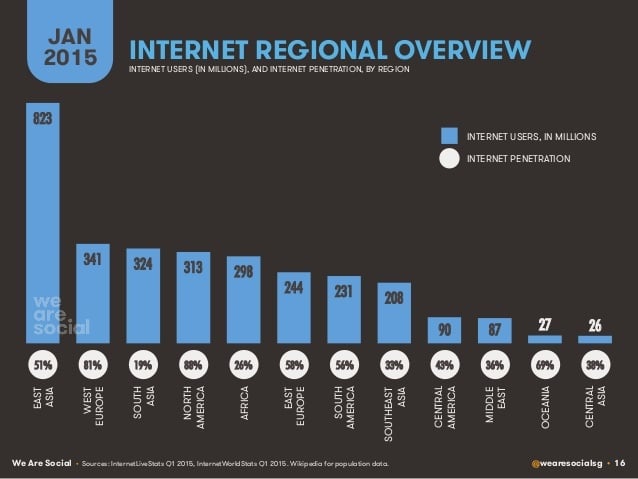
East Asia, which has largest population in the world by geographical region leads the way in number of internet users as well. 823 million people use internet in East Asia, while West Europe comes second with 341 million and Central Asia ranks the lowest with 26 million.
6. Internet Use
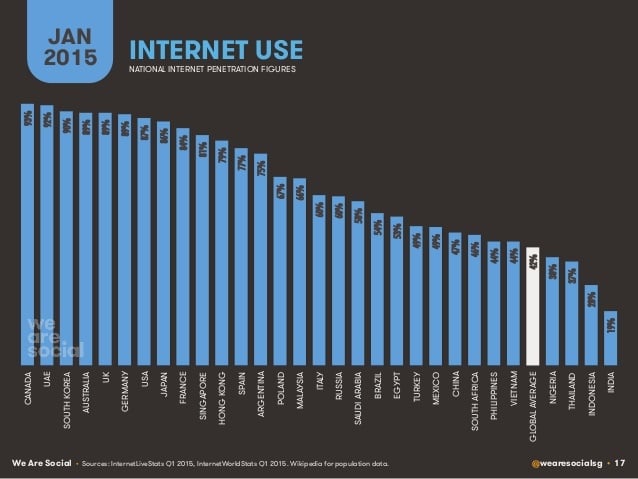
In national internet penetration figures, Canada leads the way at 93%, UAE and South Korea come respectively after Canada at 92% and 90%. Meanwhile, India, Indonesia and Thailand are the ones with lowest percentage, respectively with 19%, 28% and 37% figures.
7. Time Spent on the Internet
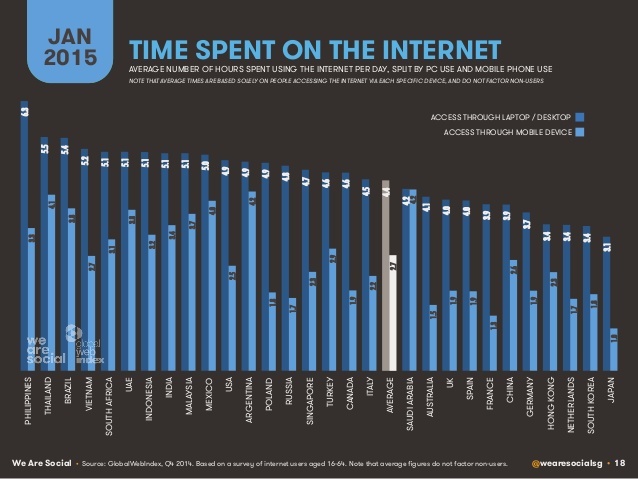
The people in Philippines spend the most time on internet via desktop and laptop devices, spending on average 6.3 hours every day while Japanese spend the least time i.e. 3.1 hours. However, the figures are different for mobile devices. Saudi Arabians spend 4.2 hours on internet in average which is the highest while Japanese come lowest yet again with 1 hour on average.
8. Share of Web Traffic by Device
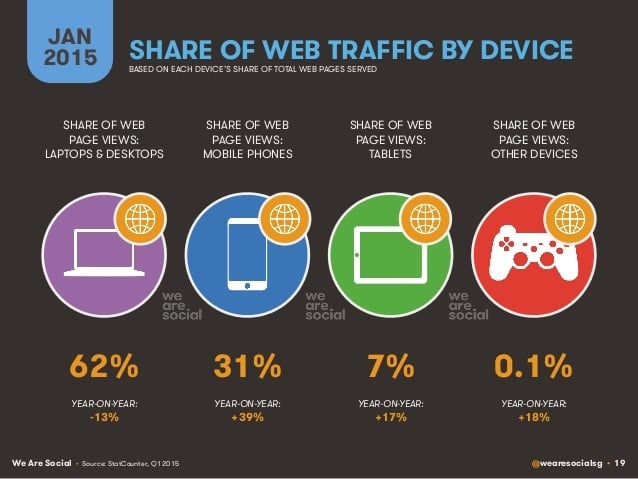
Laptops and desktops still lead the way on webpage views by devices, accounting for 62% of global webpage views. However, the trend is changing rapidly. Desktops and laptops saw 13% decrease in webpage views over the year while mobile phones saw 39% increase in the same time frame.
9. Average Net Connection Speeds
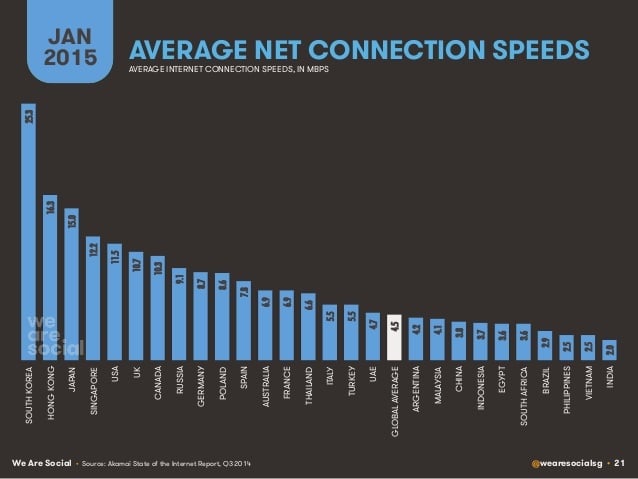
South Korea is the place to be if you want to experience fastest internet service. Average internet speed over there is 25.3 mbps while India has the slowest internet with only 2 mbps internet speed on average.
10. Social Media Use (Worldwide)
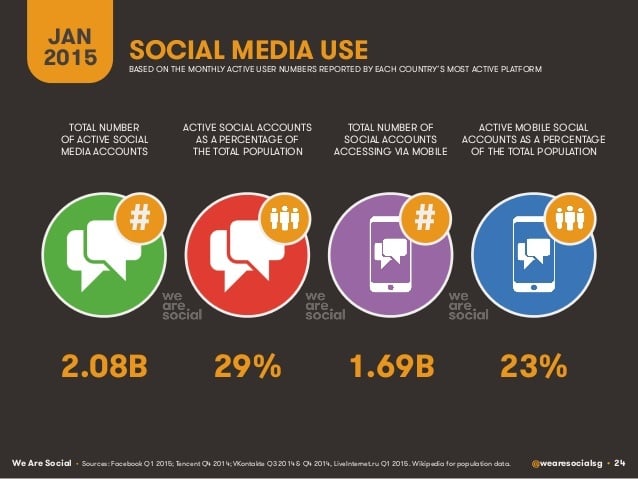
2.08 billion people have active social media accounts, which is 29% of total population of the world. Meanwhile, 1.69 billion people have social media accounts accessed via mobile, which is 23% of the world population.
11. Social Media Use (Region wise)
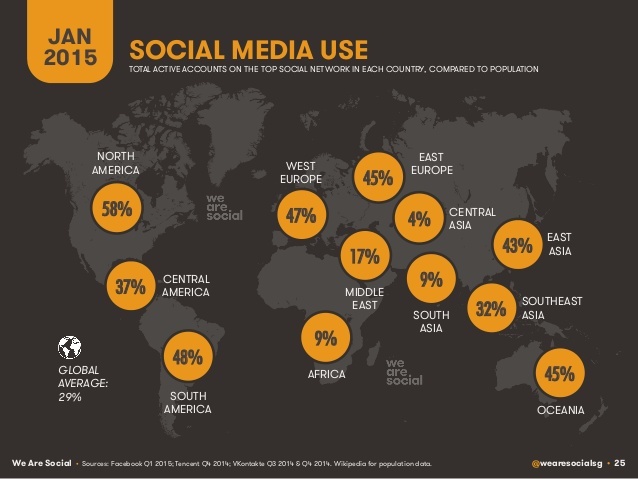
58% of the population has active accounts on social network in North America, which happens to be the largest percentage of social media usage by population. However, Africa and South Asia come lowest where only 9% of the population uses social media actively.
12. Social Media Regional Overview
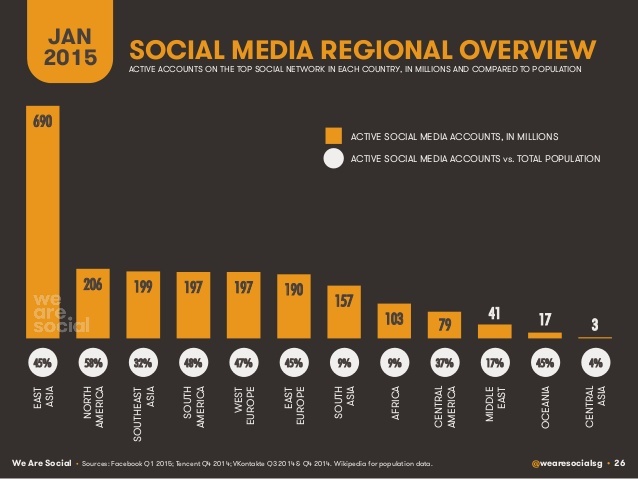
East Asia has the highest number of active social media accounts, with 690 million figures. However, North America leads the way in terms of percentage of population, with 58% of the population there having social media accounts.
13. Active Users by Social Platform
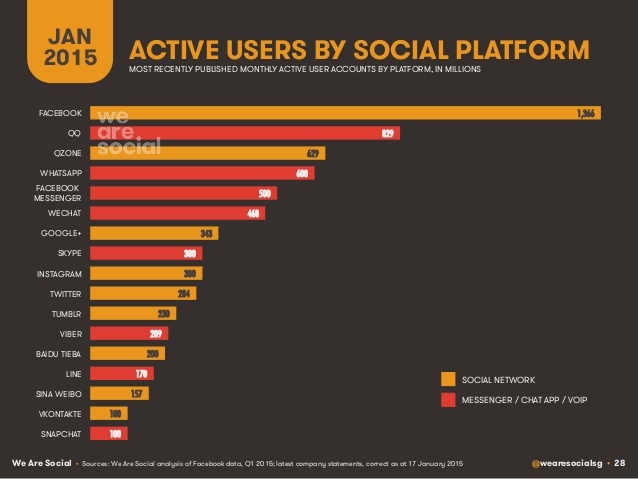
Facebook is the most popular social networking platform, which has 1,386 million accounts. Next on the list are QQ and QZone, with 829 million and 629 million figures respectively.
14. Mobile Social
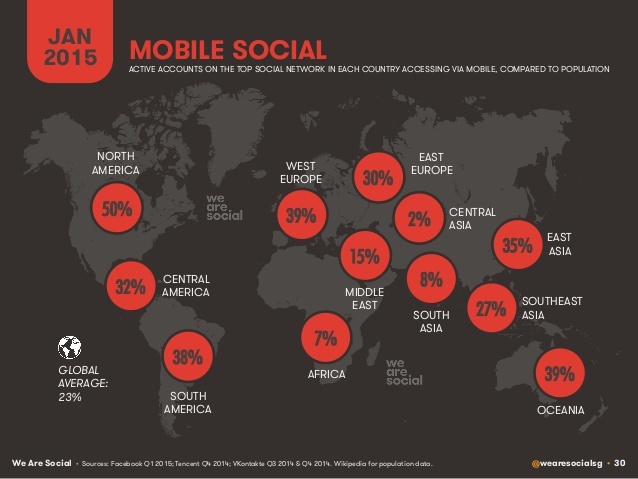
50% of social network access is via mobile devices in North America, which are the highest figures. Central Asia region ranks the lowest, where only 2% of the social media access is via mobile devices.
15. Mobile Users vs. Connections
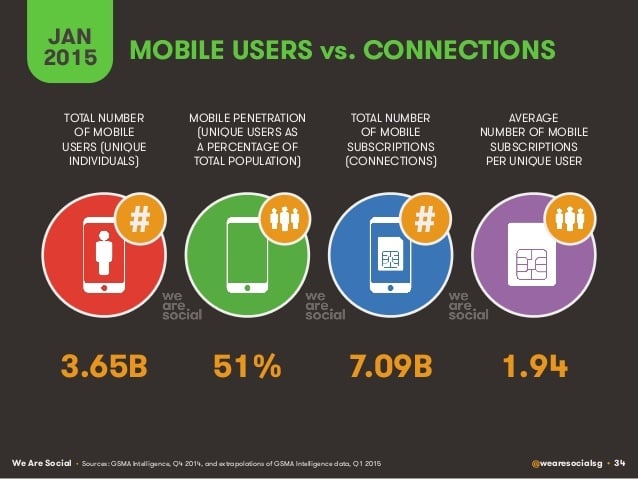
3.65 billion people in the world are mobile users, among which 51% have access to internet. Meanwhile, total number of mobile subscriptions is 7.09 billion and 1.94 is the average number of mobile subscriptions per unique user.
16. Mobile Connections
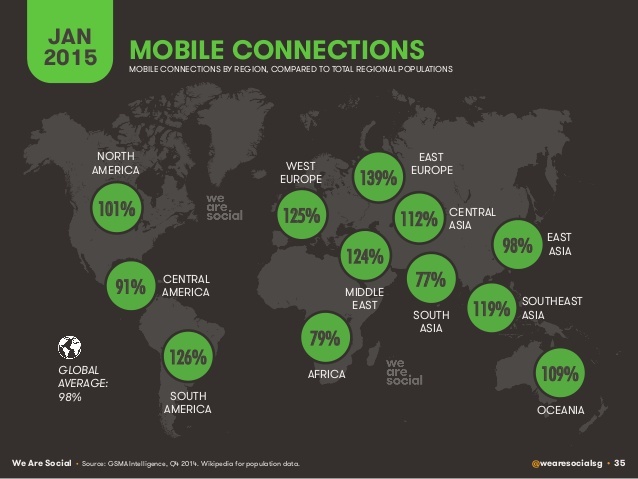
Global average mobile connections by region as compared to total regional populations is 98%. West Europe has the highest percentage at 139% while South Asia’s percentage is the lowest at 77%.
17. Mobile Phones
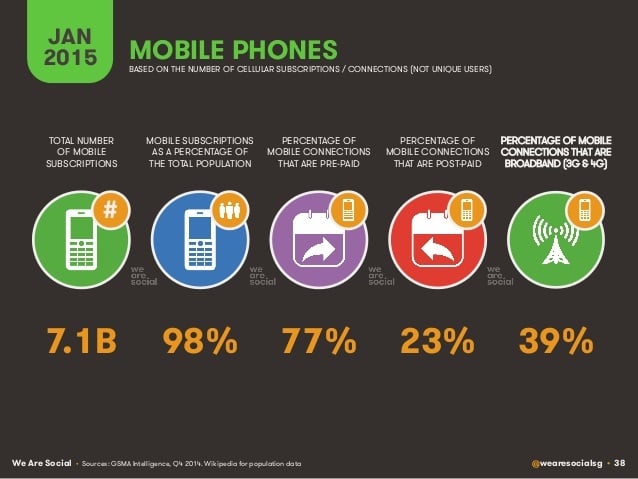
77% of the mobile connections in the world are pre-paid while 23% are post-paid. Meanwhile, 39% of mobile connections are broadband.
18. Mobile Connections by Device
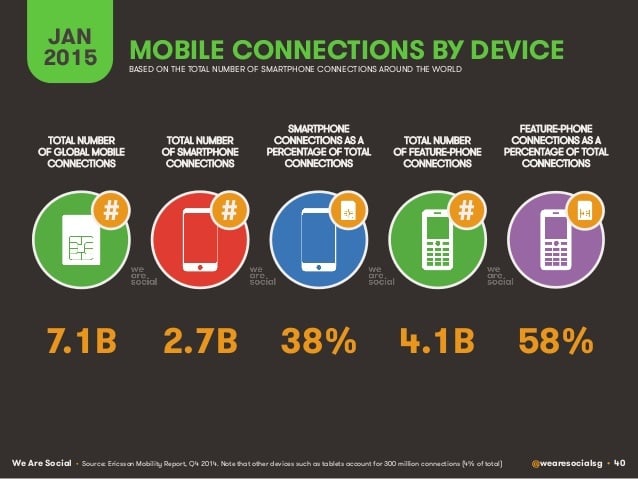
There are 2.7 billion smartphone connections in the world, which is 38% of all smartphone connections. Similarly, 4.1 billion is the total number of feature-phone connections, which is 58% of total internet connections.
19. Platform’s Share of Mobile Web
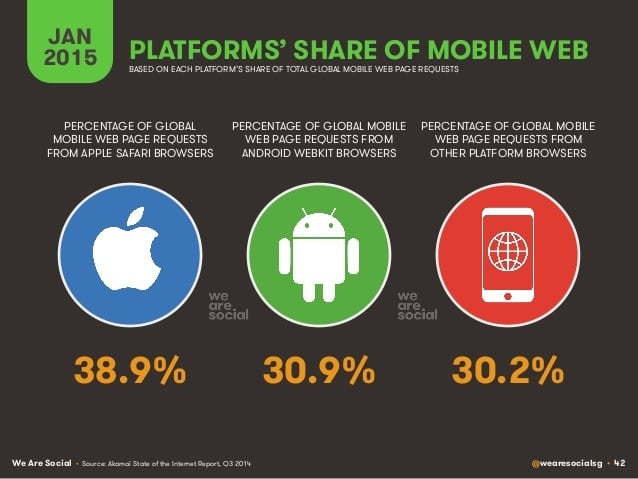
In the world of mobile, Apple’s Safari browsers lead the way in total mobile web page requests. They account for 38.9% of the requests while android web kit browsers account for 30.9% and the rest account for 30.2%.
20. Mobile Broadband
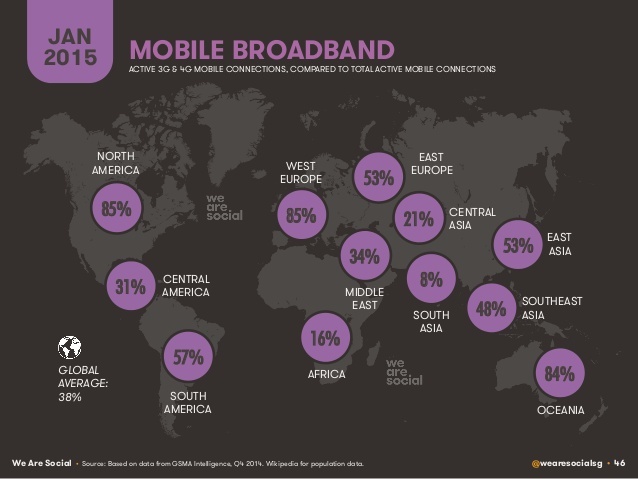
Compared to total active mobile connections, global average of active 3G and 4G mobile connections is 38%. Percentage by region is the highest in North America where 85% of the internet connections is 3G or 4G while it’s the lowest in South Asia with only 8% of the connections being elite.
21. Average Mobile Net Speeds
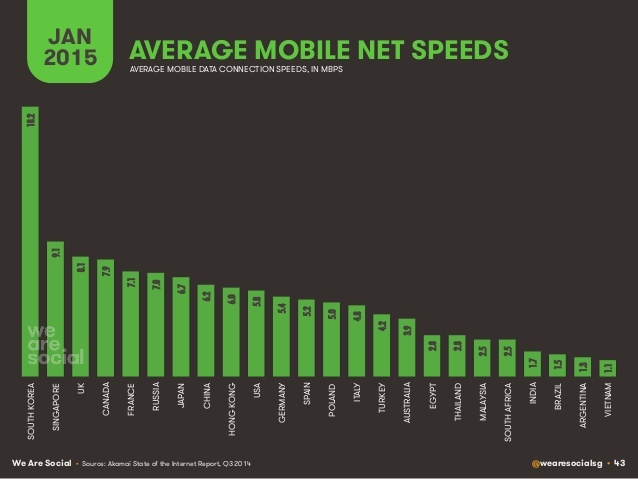
South Korea has the fastest mobile internet connection, having the speed of 16.2 mbps on average while Singapore and UK come respectively second and third with the speeds of 9.1 mbps and 8.1 mbps. Meanwhile, Vietnam has the slowest mobile internet connection, having very low speed of 1.1 mbps.
22. Global Mobile Data Growth
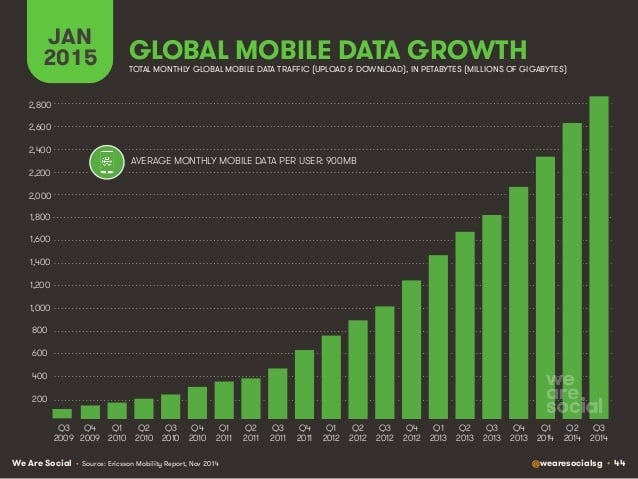
Average monthly mobile data per user is 900 MB. Mobile data usage has seen tremendous growth over the years, increasing from around 100 MB back in Q3 of 2009 to above 2800 MB in Q4 of 2014.
23. Pre-pay vs. Post-pay Connections
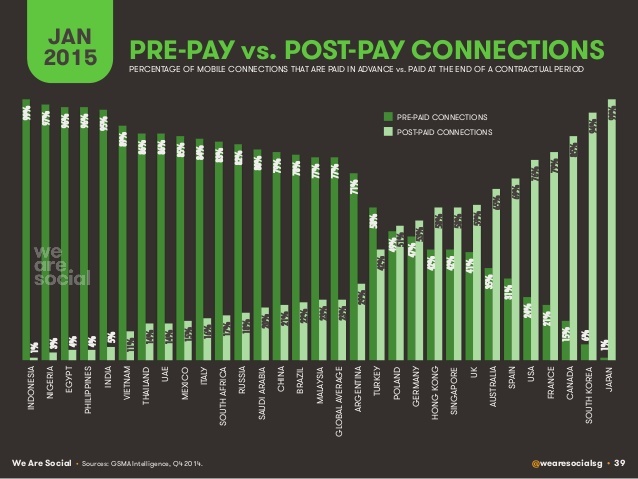
Indonesia has the largest percentage of pre-paid mobile connections within a nation, having 99% pre-paid and only 1% post-paid connections, while Nigeria and Egypt follow Indonesia respectively with 97% and 96% of the connections pre-paid. Meanwhile, Japan, South Korea and Canada each have higher percentage of mobile connections post-paid, having 99%, 96% and 85% of the connections post-paid.
24. Mobile Regional Overview
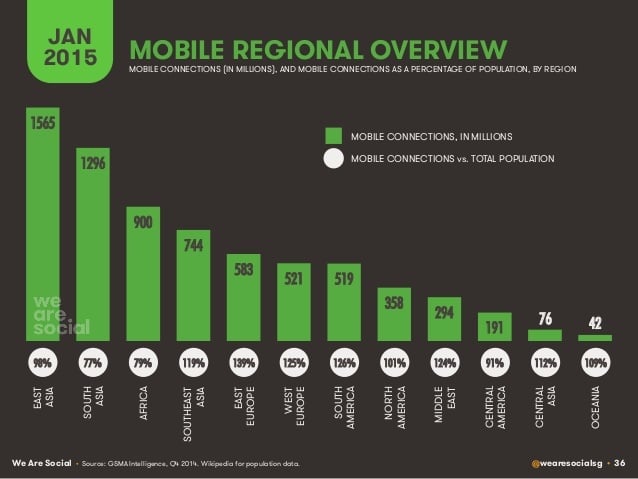
East Asia has the highest number of mobile connections by region, with 1565 million mobile connections. Meanwhile, Oceania region has the lowest numbers, with only 42 million mobile connections.
25. Mobile Connections
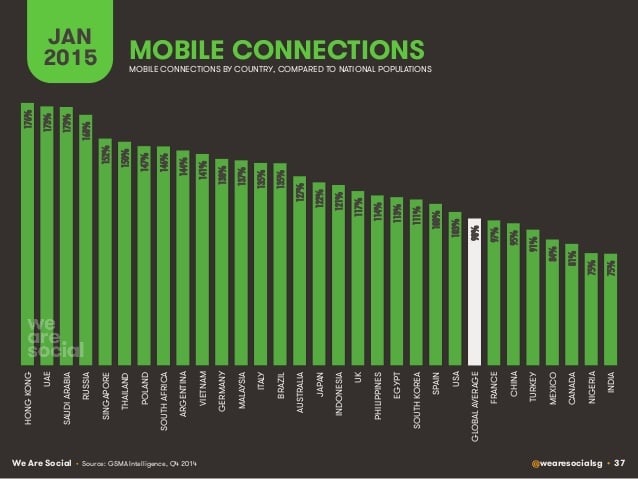
When talking of mobile connections by country, compared to national populations, Hong Kong ranks the highest by percentage, at 176%. Meanwhile, the percentage is the lowest in India, with 75% figure.
26. Digital in Canada
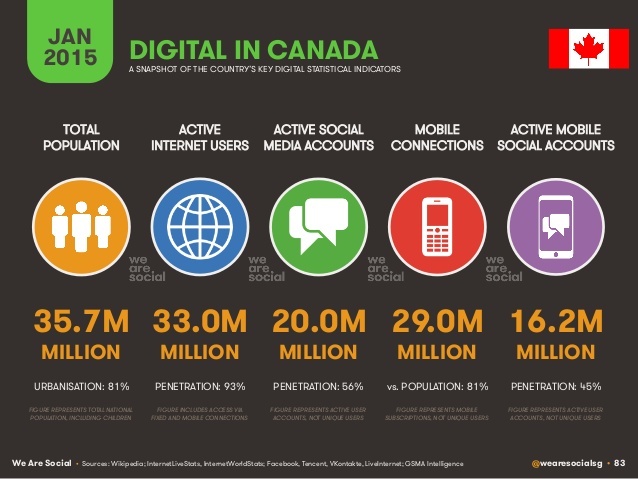
The report also presents interesting digital trends specific to certain nations. In this article, we’ll take Canada as our reference. Of 35.7 million population, 33 million are active internet users in Canada, which is 93% of the total population while 29 million mobile accounts amount to 81% of the population.
27. Annual Growth
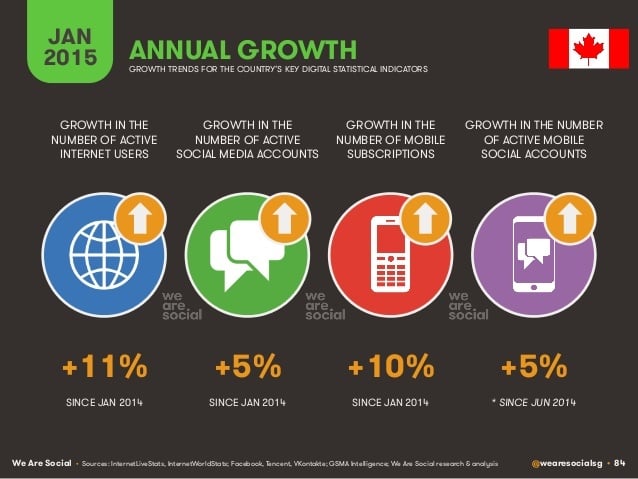
The year 2014 saw 11% growth in active internet users while 5% increase in the number of active social media accounts in Canada. In the same time period, mobile subscriptions grew by 10% and active social media accounts increased by 5%.
28. Internet Use
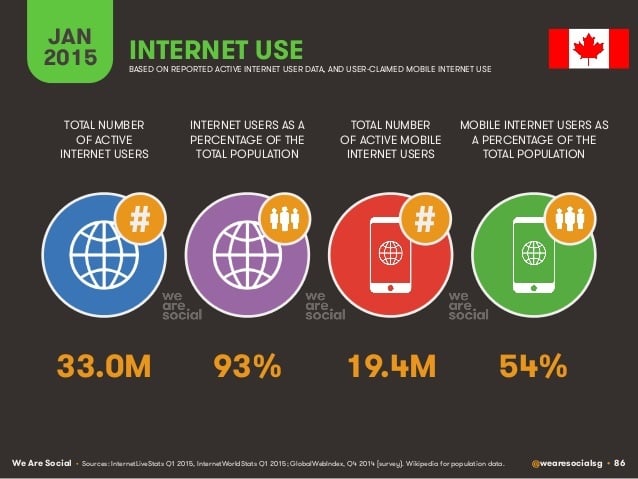
Among 33 million active internet users, 19.4 million are active mobile internet users. This happens to be 54% of the total percentage of the population.
29. Social Media Use
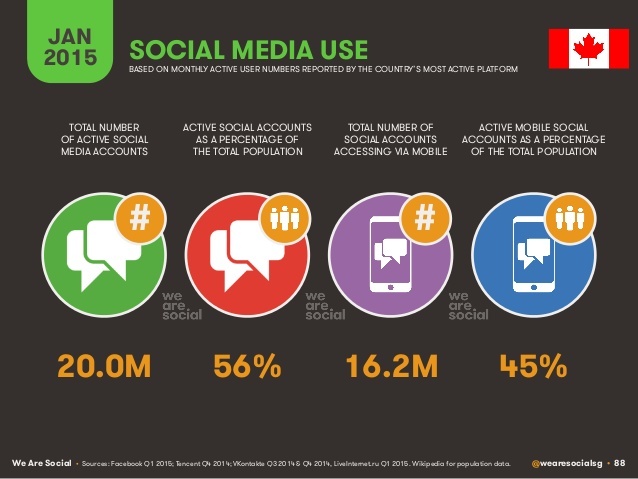
56% of the Canadian population has active social media accounts, which numbers to 20 million. Among those, 16.2 million social media accounts are accessed via mobile, which is 45% of the total population in Canada.
30. Mobile Activities
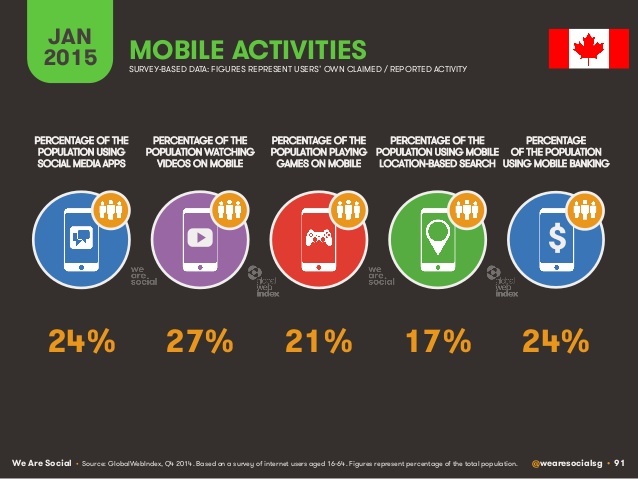
24% of the population uses social media apps while 27% of them watch videos on mobile. 21% play games on mobile, 17% use mobile location-based search and 24% use mobile banking.
All the above images are via Digital, Social and Mobile in 2015.
Featured photo credit: Digital, Social and Mobile in 2015/ slideshare.net via image.slidesharecdn.com


