Professionals and entrepreneurs today lead extremely busy lives. Despite the abundance of gadgets, tools, and other technology that can improve productivity, people today are working longer hours[1] than ever – resulting to excessive stress and reduced performance over time.
Whether you’re doing work for a client or pursuing your own projects, you need to be smarter with how you handle tasks to thrive in this competitive world. For this, you need to adopt strategies that can help you stay productive[2] and be efficient with your available resources. Most importantly, always remember that your mind is your greatest weapon – so keep it collected, focused, and organized.
What Is Critical Path Analysis and How It Can Keep You Sharp And Focused
Simply put, Critical Path Analysis (CPA) is a technique that can help you ensure the timely accomplishment of important tasks. In this process, a big goal is broken down into a set of smaller objectives. Afterwards, you must determine the time it takes to accomplish each task and the relationship between them.
In the much simpler method of using a network diagram, you specifically need the earliest start time, latest finish time, and the appropriate sequence in which the tasks must be done.
By gathering these pieces of information, CPA allows you to calculate the maximum amount of time it takes to complete the entire project. This, along with all the tasks required to accomplish the overall goal, constitute what’s known as the critical path. In case a shorter plan is available, it will also enable you to identify tasks that can be delayed or “slacked” on while still staying on schedule.
How You Can Benefit from Using CPA to Tackle Your Daily Complex Tasks
Project managers use CPA all the time when managing and tracking complex tasks, but it can also be applied by everyone in almost any field. All you need to do is to understand its model, know how it works, and learn how to map your CPA diagram. In doing so, you can take advantage of the following benefits:
• As a product manager or a leader, utilizing CPA allows you to stay focused over the course of a project. It helps you stay aware of exactly what everyone needs to do to stay on the right track.
• With the right approach, CPA is an effective risk and cost management[3] tool.
• The timeline determined through CPA can be the basis of future decision-making.
• CPA helps you spot opportunities to make tasks shorter while still accomplishing the same end results. Adjustments can be made by pumping more budget, building a bigger team, or implementing automation[4] and other time-saving strategies.
• Identifying work that can be done simultaneously to eliminate delays in the critical path.
• A fully-plotted CPA diagram will give you a complete bird’s eye view of a sophisticated project.
Even Though CPA Is a Powerful Tool, You Should Be Aware of These
While CPA can be highly beneficial to any endeavor, it isn’t without a few flaws:
• Plotting projects without sufficient data will force you to depend on assumptions.
• Large-scale projects require you to examine many dependencies, paths, and tasks – making CPA a time-consuming process.
• Even with CPA, you need to be flexible and develop contingency plans.
The Step-by-Step Instruction to Apply the Critical Path Analysis
Below are the important steps for leveraging CPA in your next big project:
1. Enumerating Critical Tasks
Before everything else, you need to identify all the things you need to do to accomplish your goal. For example, if you plan to start a new online store, below are some of the objectives you may need to hit:
A. Pick and research a niche – 1 day
B. Do keyword research – 2 days
C. Conduct surveys for product research – 10 days
D. Conduct online product research – 3 days
E. Build the site (install WordPress, set up web security, etc.) – 4 days
F. Create content – 10 days
G. Develop and optimize product pages – 20 days
2. Determining Dependencies
Next, you need to map out the sequence of all activities by determining their dependencies. Start with the tasks that must be done first before all the other tasks that lead to the finish line.
For example, you need to do A (pick a niche) first before you do B, C, or D. You must also do E (build the site) first before you begin task F and G. For now, enumerate the dependencies required for each task as they are needed for the next step.
3. Creating a CPA Diagram
The conventions in creating a CPA diagram requires three components – a node, activities, and durations.
A node is usually represented by a circle. It includes the earliest start time (EST), latest finish time (LFT), and an activity number:
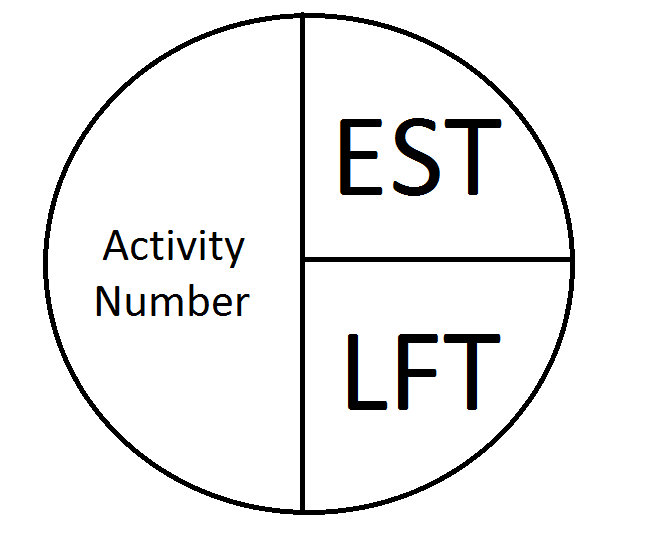
In a CPA network, tasks are indicated by arrows, which connect nodes to determine dependency. Take note that the arrows—not the nodes—represent the tasks you’ve identified earlier. Don’t confuse the activity number with the specific task.
Here is an illustration to help you understand this:
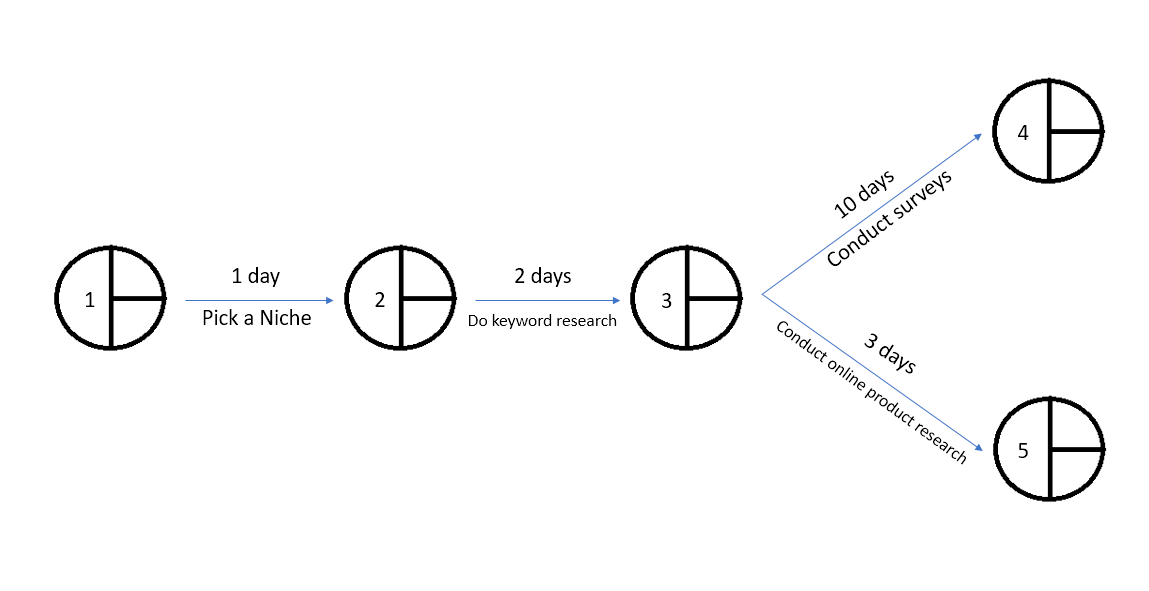
Looking at the example above, task A (pick a niche) is in-between nodes 1 and 2, while task B is in-between nodes 2 and 3. To make sense of the sequence, indicate the task description below the arrow.
Finally, the duration can be included on the opposite side of the task description. The positions of the description and duration can be interchanged freely.
4. Calculating the EST
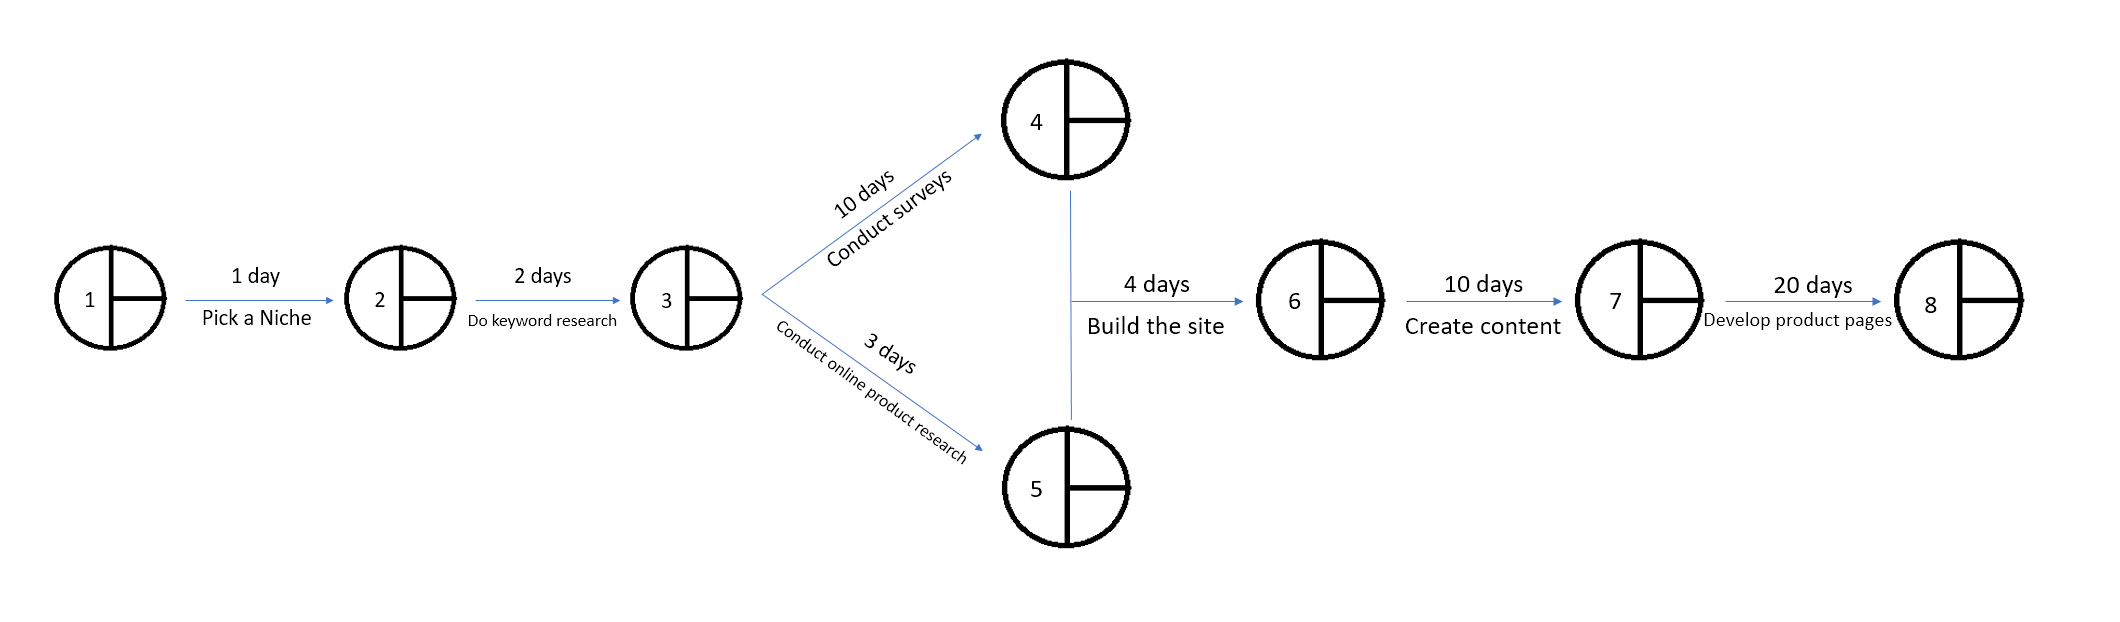
To determine the EST, you must first lay out the activities from start to finish:
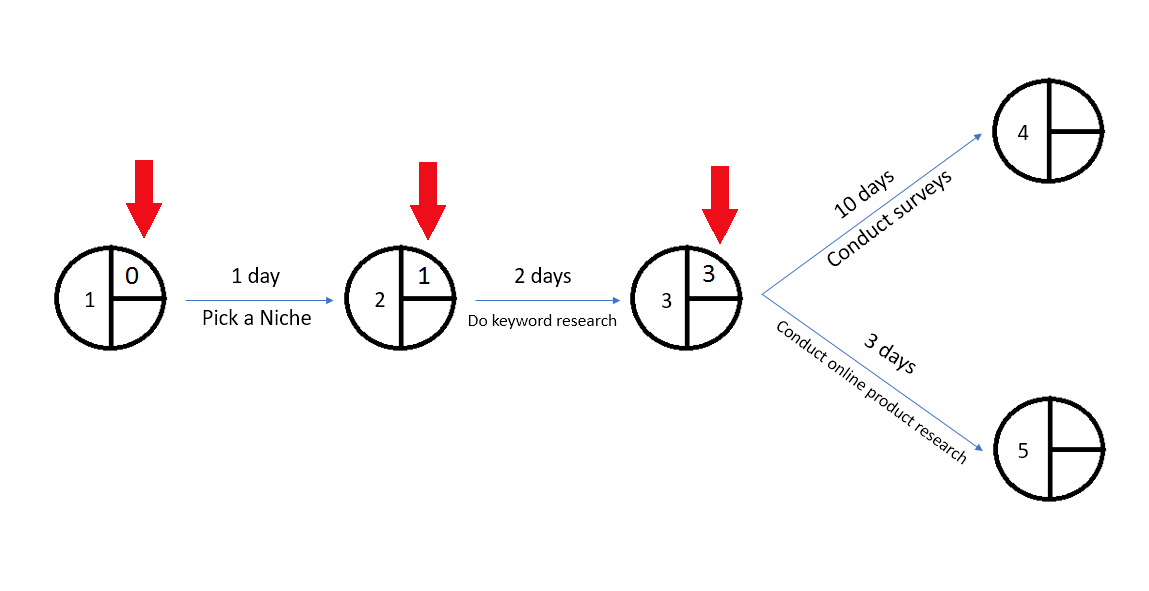
Remember that the EST denotes the earliest start time for the next task. To calculate this, you must add the total duration of all the previous tasks.
For example, since task A (pick a niche) has no activity before it, the first node’s EST equals 0. Succeeding task B (do keyword research) will have to wait for task A’s maximum duration. Thus, the next EST equals 1.
Since task B has a maximum duration of 2 days, then the third EST equals 3 – which is the total duration of tasks A and B (1 day + 2 days). This is because tasks C or D will have to wait for both of A and B’s durations.
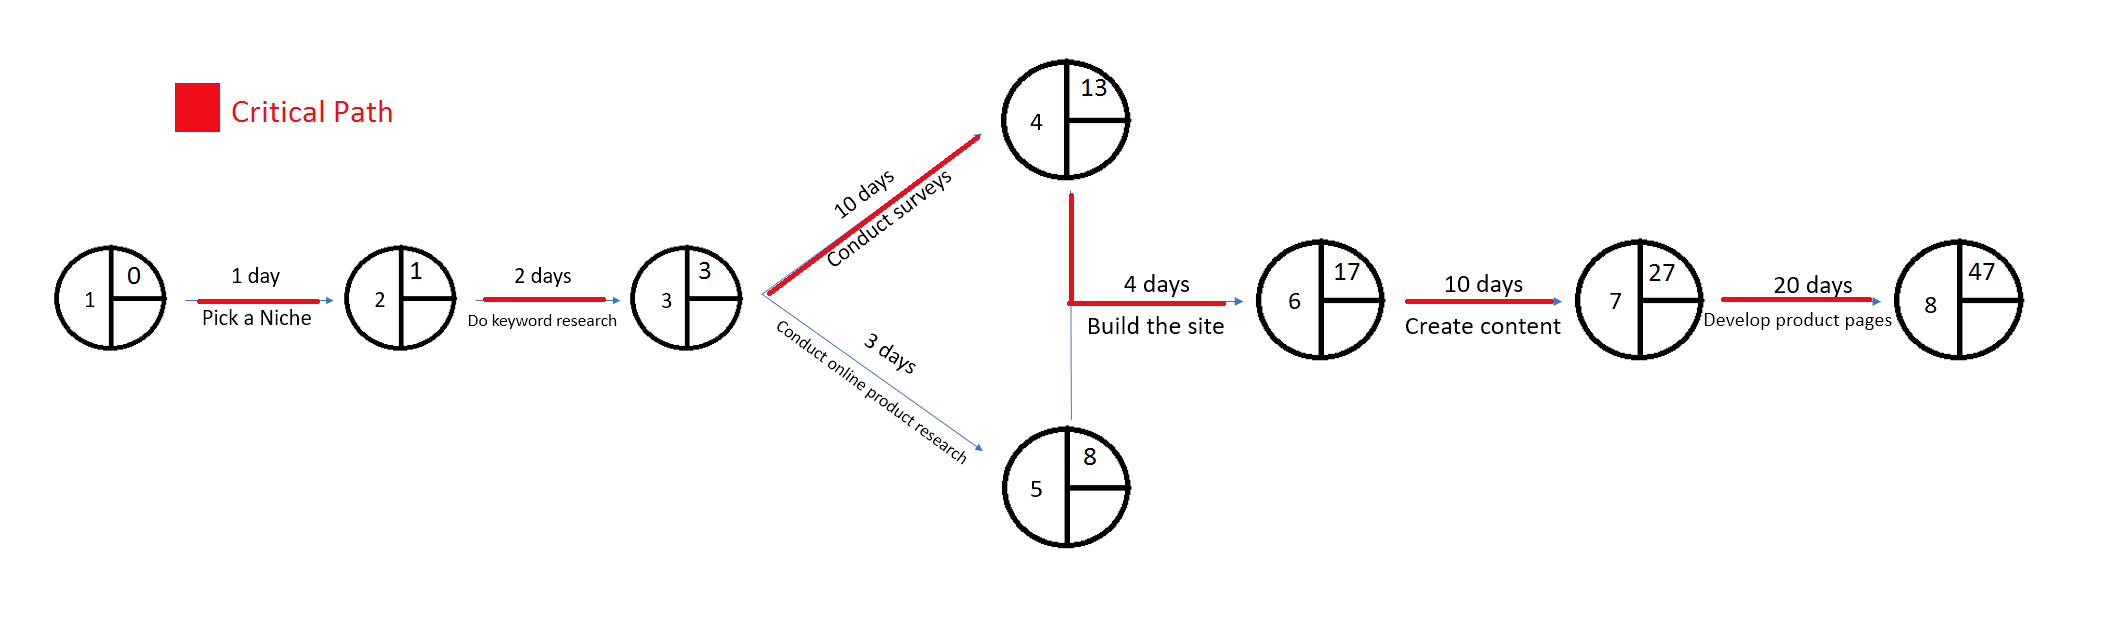
Filling in the EST for the rest of the tasks should look like:
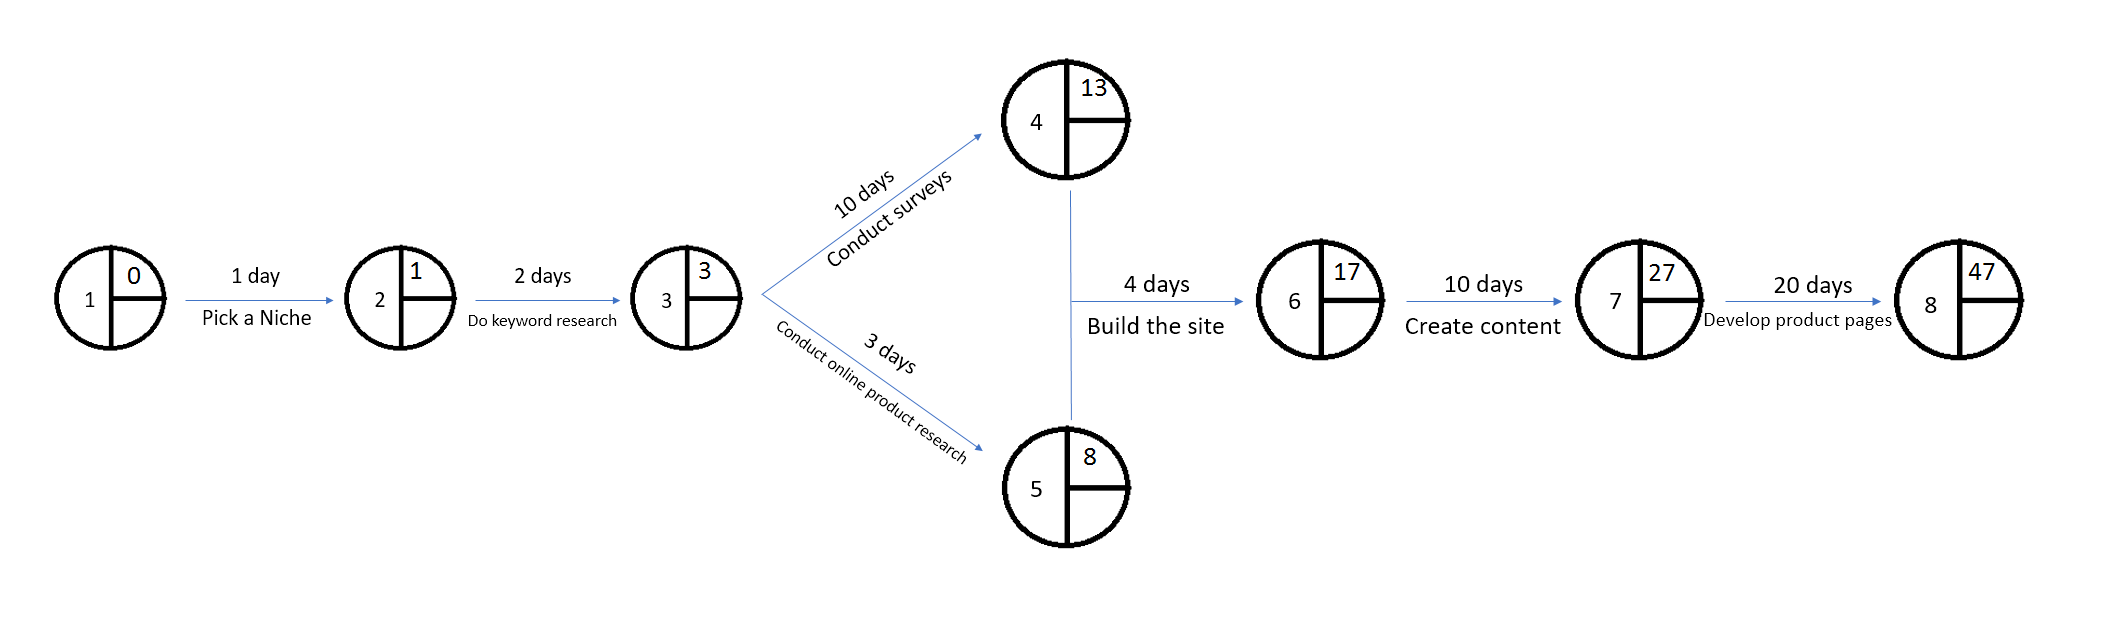
Take note that, in case there are two preceding tasks in an activity, the one with the longer duration will be used in the critical path. For example, since task C (conduct surveys) has a longer duration than task D (conduct online product research), its duration of 10 days will be used for calculating the next EST. In other words, it will be added to the total duration pool along with the next task’s duration – 3 days + 10 days + 4 days = 17 days.
After this, you should be able to plot the critical path, which should have the longest possible duration:
5. Calculating the LFT
Once you have identified the EST for all nodes, you can proceed to calculate the LFT. This time, you need to start from the left and subtract the previous task’s duration from the total.
Always remember that the last node should always have an LFT that equals the total duration of the project, while the first node should always have an LFT of zero. To calculate the next LFT, simply subtract the duration of the previous task from the right node’s EST. Since task G (develop product pages) have a duration of 20 days, and the EST of the last node is 47, then the LFT of the next node to the left will be 20 (47 days – 20 days). If you continue doing this along all paths, you’ll notice that the EST and LFT will be different in points where two or more possible tasks are introduced:
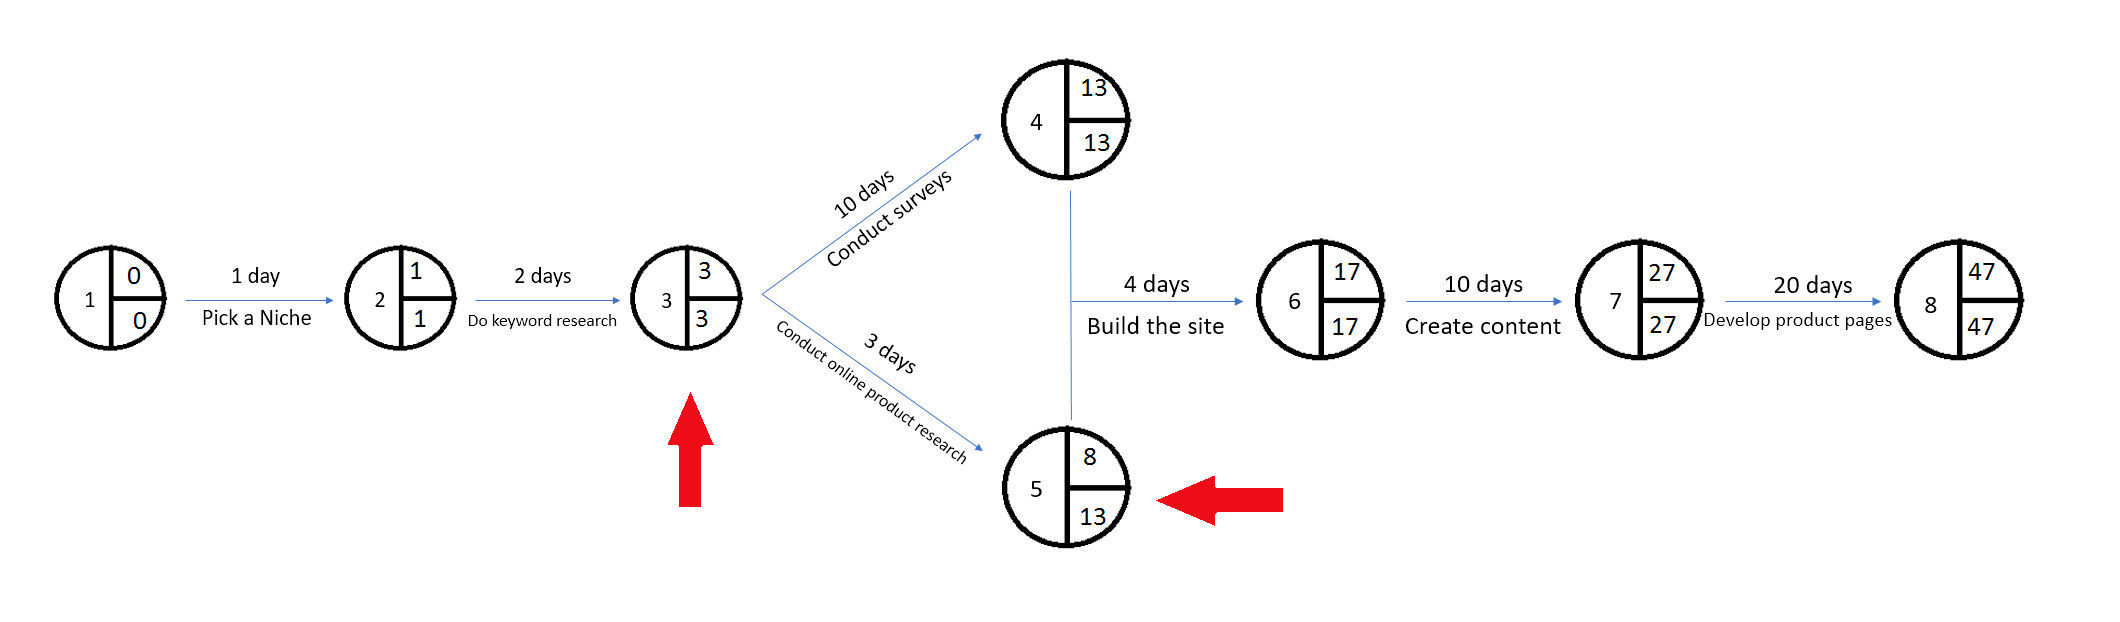
Remember that when calculating the next LFT, the smallest possible difference will always be used. In the diagram above, the difference between two tasks are 3 (13 EST – 10 days) and 5 (8 EST – 3 days). Since 3 < 5, then the value of the next LFT would be 3.
In short, it means you need to use the values from the critical path, which will enable the first node to have an LFT of zero.
6. Calculating the Float
The float denotes the amount of time a task can be delayed without affecting the timeframe of the entire project. This can be calculated with the simple formula: LFT – duration of previous task – EST of previous node.
In the example above, the LFT of task D (conduct product research) is 13, its duration is 3 days, and the previous node has an EST of 3. Applying the formula would yield:
13 (LFT) – 3 days (Duration) – 3 (EST) = 7 days.
This means you or your team can delay task D for up to a week without affecting the overall duration of the project. Take note that if you apply the same formula to a task within the critical path, you will always get zero because those tasks cannot be delayed.
Spend A Little Time In Advance, Save Much More In The End
Ready to take control of your goals? Creating a CPA diagram can be tiresome, but once you have a full view of your project’s timeline, you will feel a wave of motivation and enthusiasm. For your next step, try to use CPA diagram tools like Lucidchart[5] or learn more project management tactics from this post[6] . If the lessons above helped you gain some results, feel free to share your experience in the comments!
Reference
| [1] | ^ | U.S. Department of Labour Bureau of Labour Statistics: Are Managers and Professionals Really Working More? |
| [2] | ^ | Lifehack: 13 Strategies To Jumpstart Your Productivity |
| [3] | ^ | WhatIs: Cost Management |
| [4] | ^ | Refine: The How and Why Marketers Need to Bring AI Into their Digital Strategy |
| [5] | ^ | LucidChart: Critical Path Maker |
| [6] | ^ | Lifehack: 6 Project Management Apps No Contractor Can Do Without |